- Last Mile
- Sin categoría
- Last Mile
Deliverea Analytics: Introducing Three New Metrics for Your Logistic Analysis
A logistics chain is a complex composition of disparate systems that aren’t seamlessly integrated. Having a clear understanding of how these individual systems function helps us identify potential improvements and optimize the links in the supply chain that present challenges. With this goal in mind, Deliverea has created Analytics, a metrics system that dissects the inner workings of your logistics. This allows you to easily identify failure patterns and trends, empowering you to make informed decisions based on objective data.
Access to this information is crucial for the proper functioning of the supply chain, inventory management, and maintaining customer satisfaction. To enhance our analytics section, we are progressively adding new metrics. Here are the three latest additions:
Customer Lead Time
This metric provides insight into the average time between having the order prepared and its arrival at the customer. You can narrow it down to a specific period, and we’ll display both your average and that of the entire Deliverea customer base. This data is broken down by carriers, enabling you to assess which transporter best meets your logistical needs.
Identifying areas for improvement in the transit of your orders post-preparation, this metric is critical for customer satisfaction and meeting estimated delivery times.
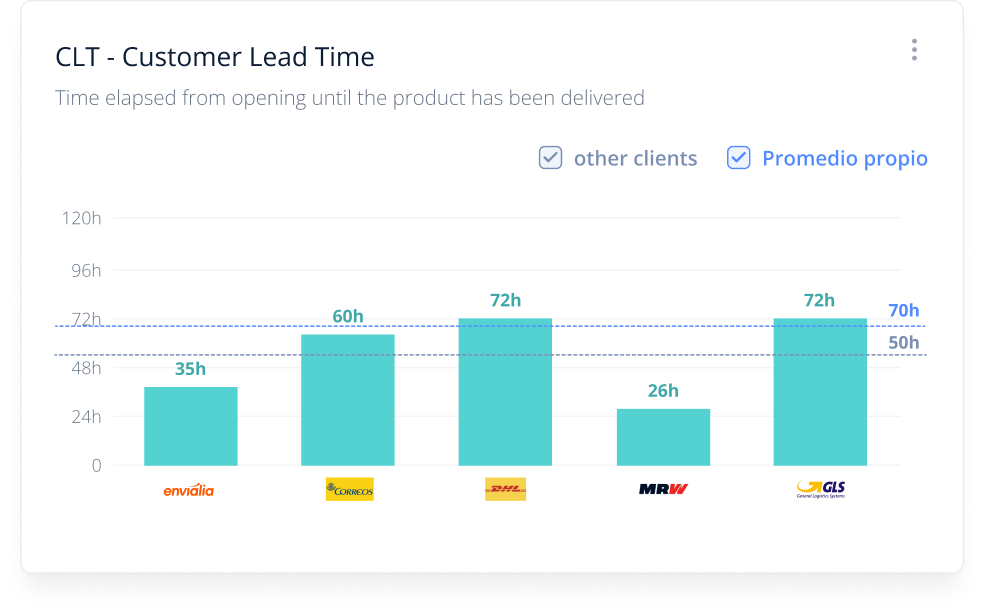
What does this metric allow you to do?
Improve the transit of your orders once they are prepared
The agility with which they are picked and transported from your distribution center to your customers.
Damaged/Lost Package Overview
This metric reveals the total number of orders with statuses lost, damaged, or stolen. Presented by carriers, you can observe the performance of each, facilitating the detection of potential patterns.
Accessing this metric enables you to implement enhancements to your transport network, increasing the percentage of successful deliveries and reducing incidents.
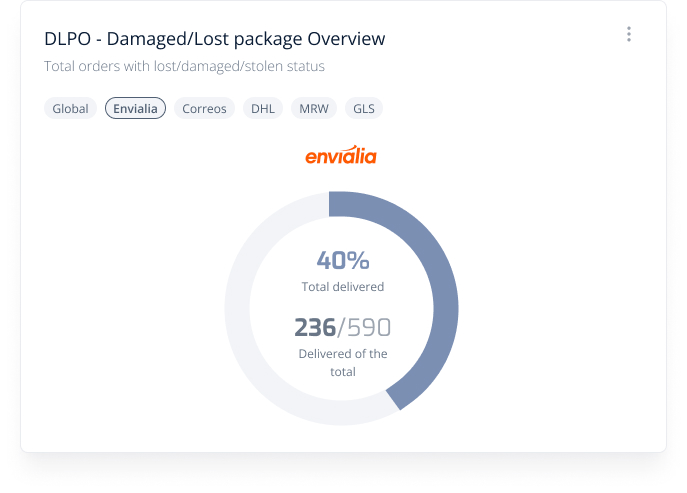
What does this metric allow you to do?
Implement performance improvements in your transport network
This way, you increase the percentage of successful deliveries and reduce incidents.
Expeditions Heatmap
We’ve developed a heatmap allowing you to identify areas where you deliver the most orders. Represented by color intensity, you can pinpoint geographic zones where orders are recurrently delivered.
This assists in better stock planning for specific areas and optimizing your transport network by region.
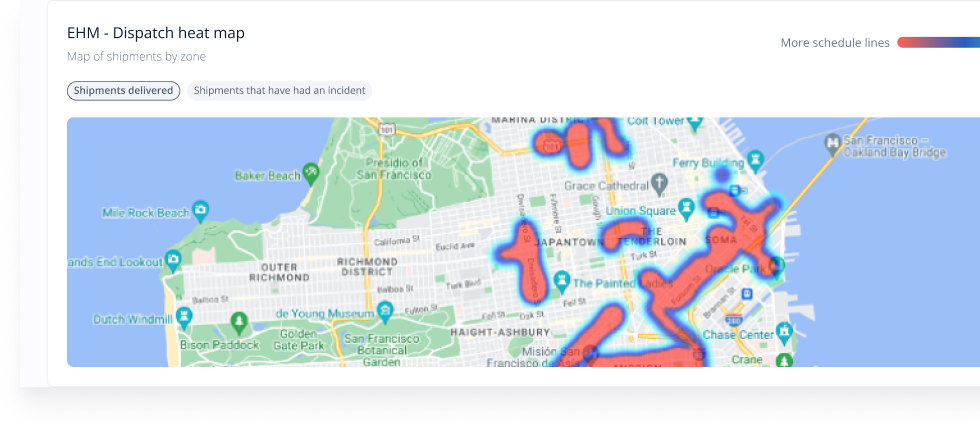
What does this metric allow you to do?
Optimize your deliveries per geographic area
This way you can assess which carrier best meets your needs in certain areas.
At Deliverea, we develop tools to optimize your logistics, shipping, and parcel delivery systems. If you want to know how we can help your business grow, don’t hesitate:
If you liked this article, share it on your social media:
